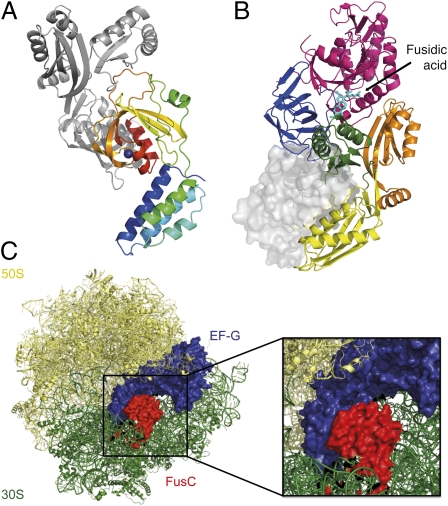
Fig. 3.
Model of the FusC⋅EF-G complex, showing interactions between the ZBD of FusC and domains 3 and 4 of EF-G. (A) Ribbon diagram of the docked FusC⋅EF-GC3 complex. FusC is represented in rainbow colors, and EF-GC3 in gray. (B) Alternative representation of the two molecules, with a ribbon diagram of EF-G colored by domain (as per Fig. S1) and FusC surface representation in gray. The FA binding site on EF-G is also indicated. (C) Model of EF-G simultaneously bound to a FusB-type protein (FusC) and the ribosome, illustrating the multiple steric clashes that would occur between FusC and the 30S subunit. Coordinates for the EF-G–bound ribosome are from PDB ID code 2WRI.

