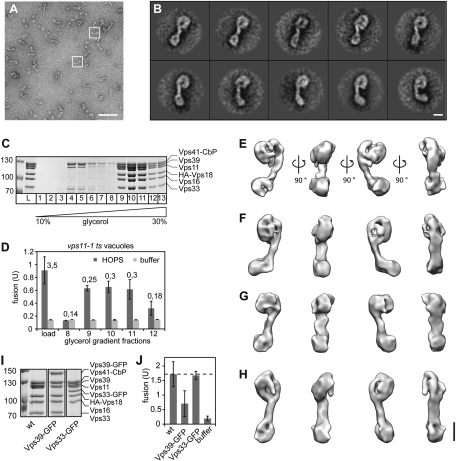
Fig. 1.
Isolation and structure of the HOPS complex. (A) Typical micrograph area of the negatively stained HOPS (Vps39-GFP) tethering complex. Representative particles are boxed in white. (Scale bar, 100 nm.) (B) Representative class averages, each containing between 12 and 27 particles. Fig. S2 shows the complete set of class averages. (Scale bar, 10 nm.) (C) Purification of HOPS via a glycerol gradient. Overproduced HOPS with TAP-tagged Vps41 (16) was purified from yeast via IgG Sepharose as described in Experimental Procedures, then separated on 10–30% glycerol gradients. (D) Fusion activity of HOPS. Indicated fractions of C were applied to reporter vacuoles from vps11-1 strains. Six microliters of each fraction were analyzed per fusion reaction. Numbers indicate the protein concentration in the sample. (E–H) 3D reconstructions of the yeast HOPS complex using the random conical tilt approach and 3D multireference alignment. Four different conformations (E to H) were chosen. Shown are four different side views, after horizontal rotation of 90° around their longest axis. Table S1 shows the volumes of the structures. (Scale bar, 10 nm.) (I) Purification of wild-type and GFP-tagged HOPS complexes. Coomassie-stained SDS/PAGE gels of HOPS, HOPS (Vps33-GFP), and HOPS (Vps39-GFP) are shown. (J) Fusion activity. The different GFP variants were analyzed in fusion as in D. Fusion was compared to wild-type HOPS (wt) was set to 100%. SDs are given, n = 3.

