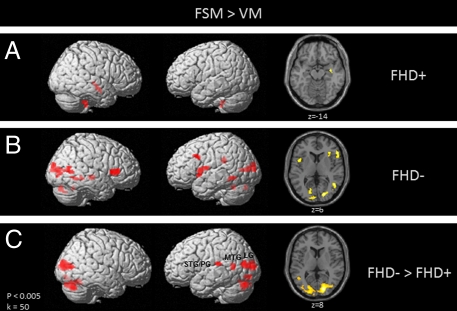
Fig. 1.
Statistical parametric maps showing brain activation during phonological processing (FSM > VM) for children with (A) and without (B) a familial risk for DD, as well as group differences between children with compared to without (FHD− > FHD+) a familial risk for DD (C). FHD− show significantly greater activation compared to FHD+ children in bilateral occipitotemporal and left temporoparietal brain regions, as well as left and right cerebellar regions.

