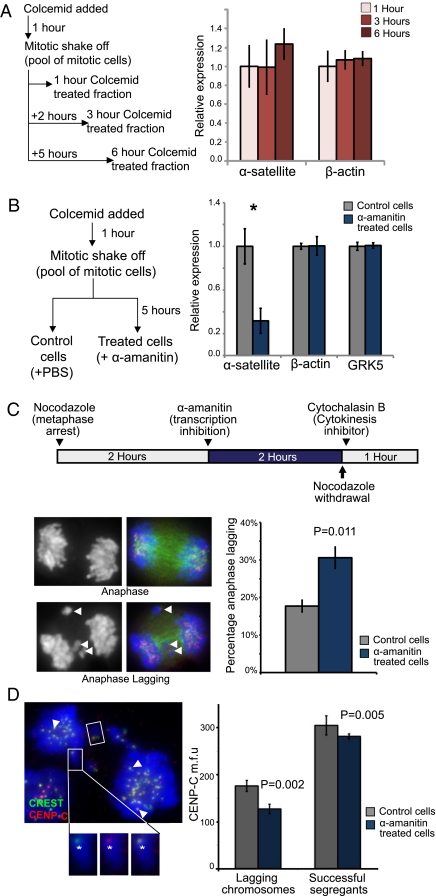
Fig. 4.
Transcription of α-satellite DNA during mitosis is mediated by RNAPII and is required for correct kinetochore function. (A) A mitotic shake-off protocol and real-time qRT-PCR were used to measure the levels of α-satellite RNA in metaphase-arrested cells. Briefly, 14ZBHT cells were treated with colcemid for 1 h, and mitotic shake-off was performed to isolate a population of mitotic-enriched cells (average mitotic index = 70%; n = 5). Cells were maintained in mitotic arrest for an additional 0, 2, or 5 h to give 1-, 3-, and 6-h mitotic-arrested populations. Total RNA was reverse-transcribed into cDNAs for real-time qRT-PCR using the ΔΔCT method (normalized against the mean of three housekeeping genes, β-actin, GAPDH, and HPRT). No significant change in the levels of α-satellite or actin transcripts was detected. (B) The effect of RNAPII inhibition on centromere transcription was assayed. A pool of mitotic 14ZBHT cells was isolated via mitotic shake-off and split into two fractions, an α-amanitin–treated fraction (incubated with 50 μg/mL α-amanitin) and a control fraction (PBS added), for a further 5 h. RT-PCR quantification was performed as described previously. α-Amanitin–mediated RNAPII inhibition caused a significant decrease in α-satellite levels (by 68%; n = 4; *P = 0.016; Student's t test). Transcripts of the control genes, G protein-coupled receptor kinase 5 and β-actin, were unaffected. (C) A protocol was designed to target RNAPII inhibition to mitotic cells, and an anaphase-lagging assay was used to detect kinetochore dysfunction. 14ZBHT cells were treated with nocodazole for 2 h to enrich for mitotic cells; then cells were treated with α-amanitin (50 μg/mL) or PBS for a further 2 h. Cells then were released from mitotic arrest and placed in cytochalasin B-containing medium to inhibit cytokinesis. One hundred anaphase events were scored as normal or anaphase lagging. Arrowheads indicate examples of lagging chromosomes. α-Amanitin treatment caused a significant increase in lagging anaphases (n = 3; P = 0.011; Student's t test). (D) An anaphase-lagging cell. Lagging chromosomes are indicated by a box, and successfully segregated sister kinetochores are indicated by arrowheads. Insets show close-up images (CREST in green, CENP-C in red) (Left) and merged images (Right) of a lagging chromosome. The fluorescence intensities of CENP-C at the kinetochores of lagging chromosomes (an example is indicated by asterisk) and successfully segregated chromosomes were measured. After α-amanitin inhibition, the mean fluorescence intensity of CENP-C at the kinetochores of the successfully segregated chromosomes was reduced slightly (by 7%; P = 0.005); an even greater reduction of CENP-C was seen at the kinetochores’ lagging chromosomes (28%; P = 0.002; based on 77 control and 107 α-amanitin–treated chromosomes from three biological replicates). Error bars in A–D represent SEM.

