Fig. 4.
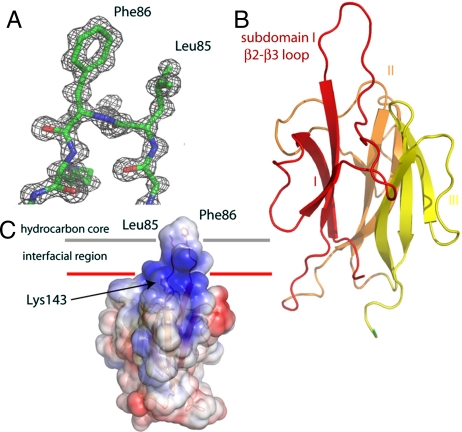
Structure and membrane-binding mechanism of the MABP domain. (A) Electron density (2Fo - Fc) synthesis highlighting the tip of the β2–β3 loop of subdomain I. (B) Overall fold of the MABP domain colored by subdomain. (C) Model for membrane binding colored according to electrostatic potential, with blue electropositive and red electronegative. Hydrophobic residues at the tip of the β2–β3 loop are highlighted and their potential role in membrane insertion shown.

