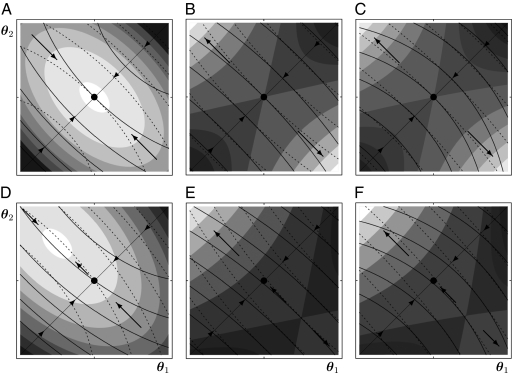
Fig. 2.
Fitness landscape for the case of two equivalent modules (A–C) and two nonequivalent modules (D–F). Contours of the fitness landscape are indicated by shading with lighter shades indicating higher fitness. Solid circles indicate the location of fitness maxima  in the constrained trait. The expected direction of the evolutionary dynamics is indicated by arrows. The solid and dashed curves depict iso-performance curves of the underlying performance functions F1 and F2, respectively, as introduced in the Fig. 1 legend. (A) Iso-performance curves are convex for F1 and concave for F2, indicating that functional differentiation decreases performance in both tasks. Thus, the point
  is a fitness maximum. (B) Iso-performance curves are concave for F1 and convex for F2, indicating that functional differentiation increases performance in both tasks. Thus, the point
  is a saddle point of the fitness landscape. (C) Iso-performance curves are concave for both F1 and F2, indicating that functional differentiation increases performance for task 1 and decreases performance for task 2. In this particular example the increase in performance in task 1 is sufficiently large to outweigh the decrease in performance in task 2 such that the point
  is still a saddle point of the fitness landscape. For plots D, E, and F it is assumed that module 1 has an intrinsic advantage in contributing to task 2 whereas module 2 has an intrinsic advantage in contributing to task 1. Each plot in the lower row is a perturbation of the corresponding plot in the upper row. In D nonequivalence of modules moves the fitness maximum above the diagonal whereas in E and F nonequivalence moves the saddle point below the diagonal. In both cases, selection favors specialization of module 1 for task 1 and of module 2 for task 2. Note that extrema of the fitness landscape correspond to points
  where iso-performance curves for F1 and F2 are tangent to each other. Plots show the function
  with F1 and F2 defined in Eq. S2 in SI Text A with
  and
and  .
.

