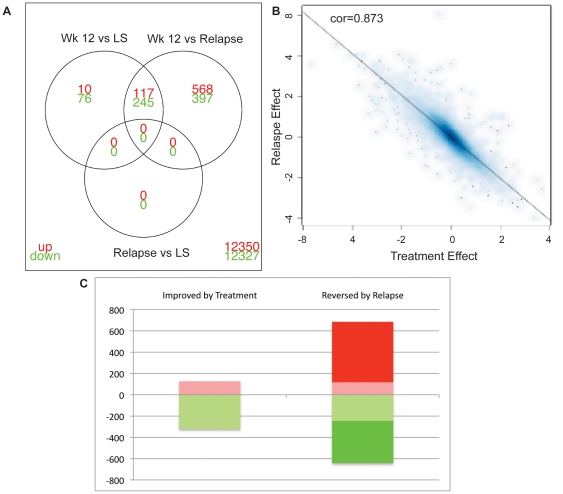
Figure 5. Genomic characterization of relapsed psoriasis lesions.
(A) Venn diagram showing DEGs for different comparisons, week 12 versus LS; week 12 versus relapse; relapse versus LS. There were no unique DEGs in relapse compared to LS skin. (B) Scatter plot showing an excellent correlation between the “treatment effect” and “relapse effect”. (C) Number of genes improved by treatment and reversed by relapse. Red blocks were increased DEGs, green blocks were decreased DEGs.

