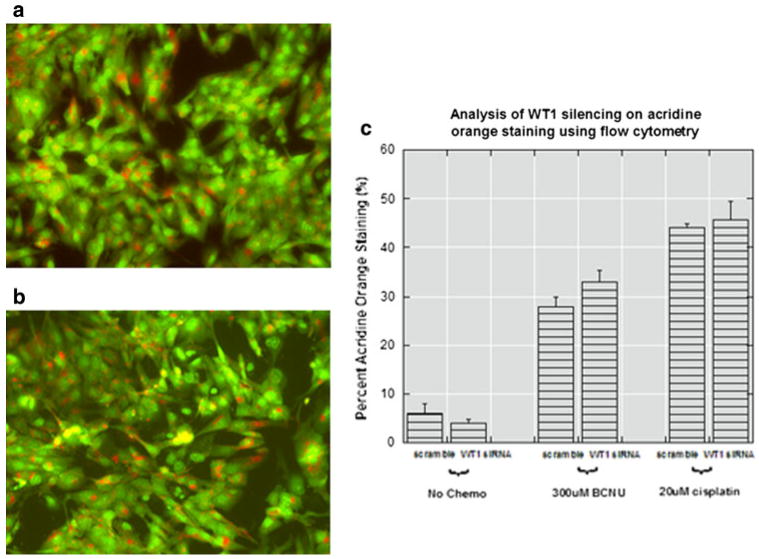
Fig. 7.

Effect of WT1 silencing on autophagy. Representative fluorescent microscopy images (×20) of acridine orange staining in T98G cells treated with (a) scrambled or (b) WT1 siRNA. The number of orange autophagosomes in each group is approximately the same by visual inspection so flow cytometry was used for quantification. c Flow cytometry confirmed that with or without chemotherapy, silencing WT1 did not significantly alter the amount of red fluorescence per cell. The Q2 quadrant represents cells containing red (acidic vesicular organelles) and green (DNA) fluorescence
