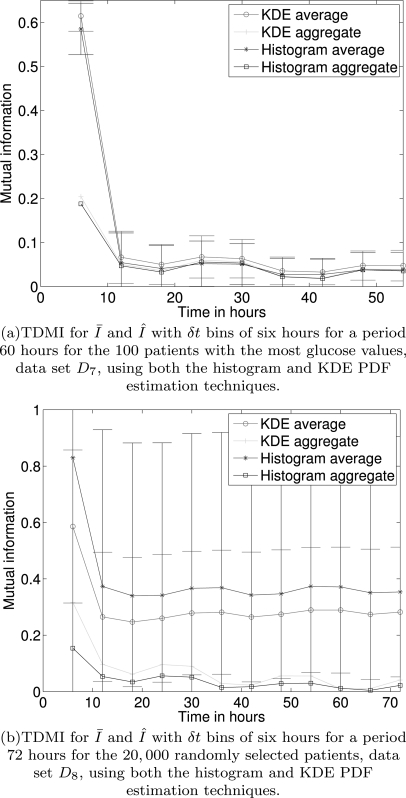
Figure 6.
(Color online) The TDMI for both and with δt bins of 6 h for a period of a few days for D7 and D8; note that the bias estimates can be found in Tables 8, TABLE VII.. With respect to (a), note the following: for δt ≤ 6 h, δI > 0 and for δt > 6 h, δI ≈ 0; the KDE and histogram estimates are extremely similar; the diurnal (daily) periodic variation in correlation of glucose is clearly evident in both and . With respect to (b), note the following: for all δt δI is consistent and likely zero within bias; the KDE and histogram estimates differ greatly, implying the presence of small sample size effects in the average TDMI calculation; the diurnal (daily) periodic variation in correlation of glucose is clearly evident in both and in all but the KDE estimated TDMI average.

