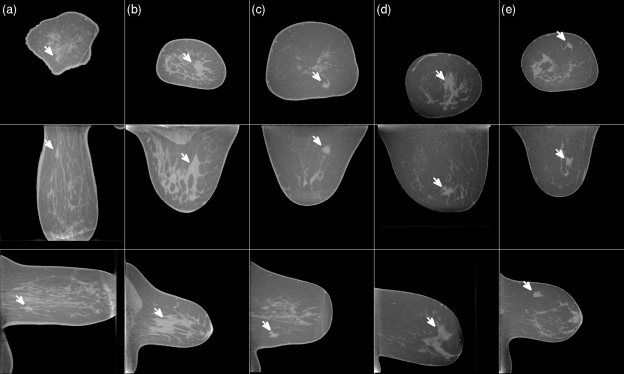
Figure 10.
Examples of CT cases in which the lesion was missed by the detection algorithm. As in Fig. 9, each column shows a coronal, axial and sagittal slice centered on the mass. The white arrow indicates the location of the mass. All masses are malignant. The gray scale window is [−400 HU, 300 HU] and is equal for all slices shown in Figs. 91011.

