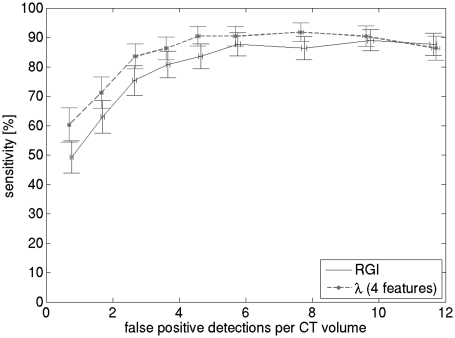
Figure 6.
FROC performance of the RGI feature, as well as the complete CADe algorithm with four features. CADe sensitivity is per case, and was estimated using a leave-one-case-out scheme. The length of the error bars is two standard deviations, estimated from 1000 bootstrap samples. Three features indicates that feature selection and LDA classifier training was performed using all lesions as training data, four features indicates that the training data consisted of malignant lesions only.

