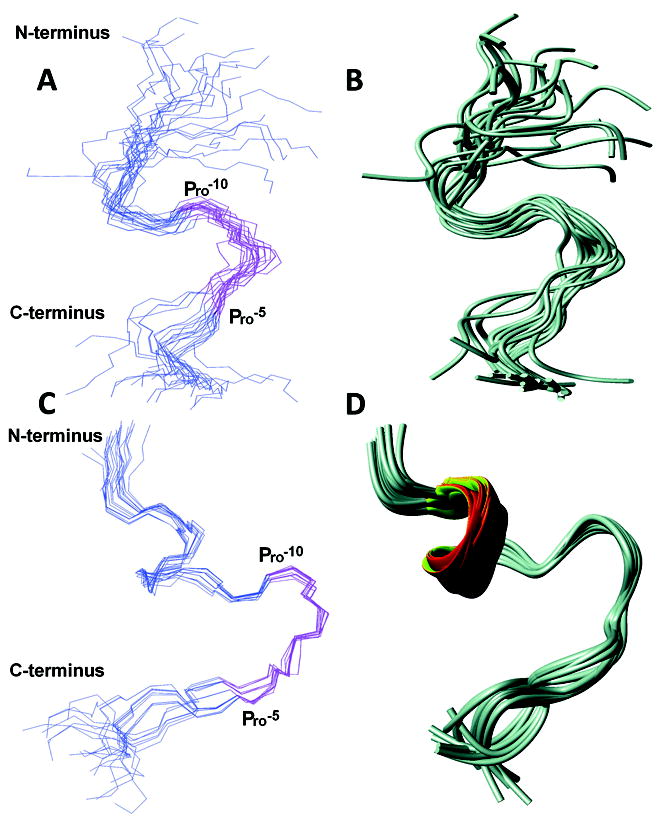
Figure 3.

NMR structures of KAP25 in presence of SPase I Δ2-75 (A and B) and DPC (C and D). Disordered regions (residues up to -18 and above +4) are excluded for clarity. The backbone residues are represented in blue and the -10PLLFTP-5 region is highlighted in pink. Residues -15 to +3 are used for superimposition. (A) Backbone superimposition of 20 lowest energy conformers of KAP25 in presence of SPase I Δ2-75. (B) Ribbon representation of the ensemble. (C) Backbone superimposition of 20 lowest energy conformers of KAP25 in the presence of DPC micelles at a molar ratio of 1:1.4. (D) Ribbon representation of the ensemble. Molecular graphics images were produced by MOLMOL.
