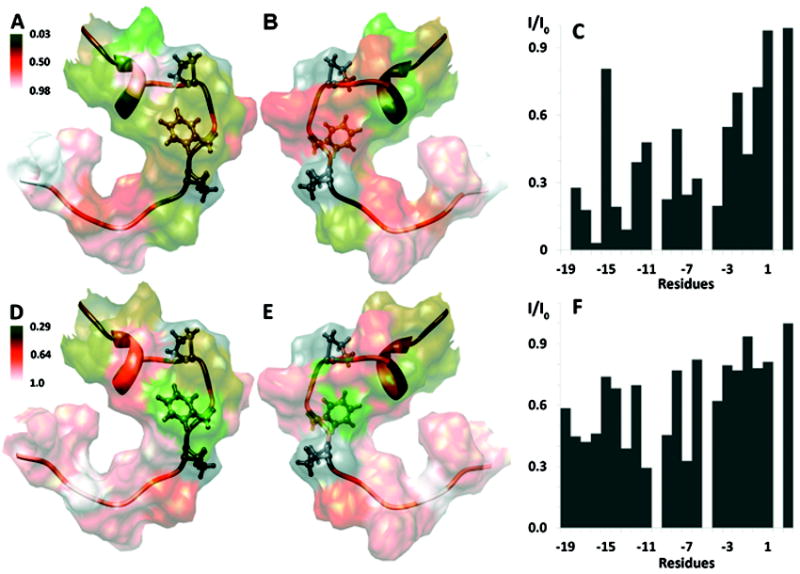
Figure 4.

Summary of KAP25 (in ribbon representation) interactions with DPC micelles. The disordered regions (N-terminal residues to -18 and C-terminal to +4) are excluded for clarity. Pro-10, Phe-7, Pro-5 are highlighted in ball and stick representation. The intensity ratios from the PRE experiments measured in the presence of 5- and 16-DSA are mapped onto the surface of Kap25 (A/B and D/E respectively, with 180° rotation between corresponding panels). A green-orange-white color gradient is used (respective color keys are shown adjacent to the figure). The normalized experimental intensity ratios for the KAP25 backbone Hα protons in the presence (I) and in the absence of (I0) of paramagnetic agents are plotted against residue numbers in panels C and F for 5- and 16-DSA, respectively. An intensity ratio of one indicates no effect of the spin label. Molecular graphics images were produced by UCSF Chimera.
