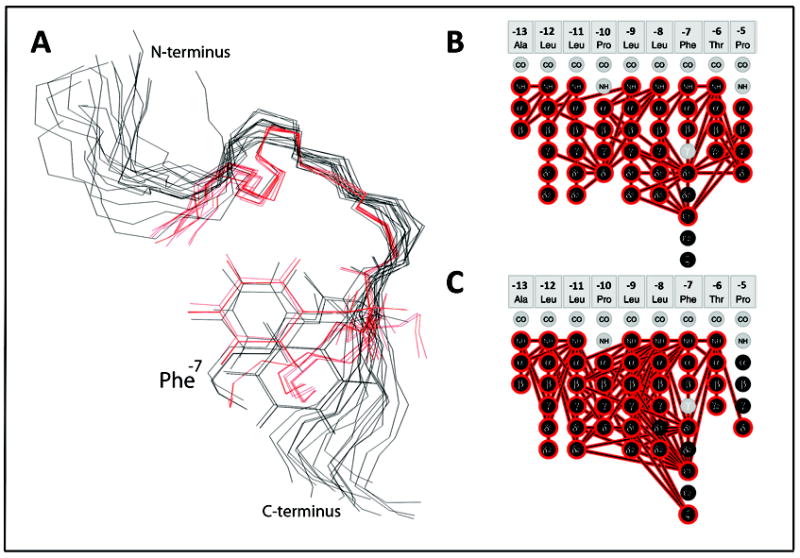
Figure 5.

Structural comparison of the two KAP25 folds. (A) The overlay of the KAP25 bound to SPase I Δ2-75, shown in black, and KAP25 in DPC micelles, shown in red. Only the “U-turn” region, structurally restricted by two prolines, Pro-10 and Pro-5, was used for the backbone superposition. The Phe-7 side chains of several representative conformers from both ensembles are shown for comparison. (B) and (C) panels illustrate distance restraints, derived from the observed NOE peaks, which have been used in structural calculations for KAP25 bound to SPase I Δ2-75 or DPC, respectively.
