Figure 4.
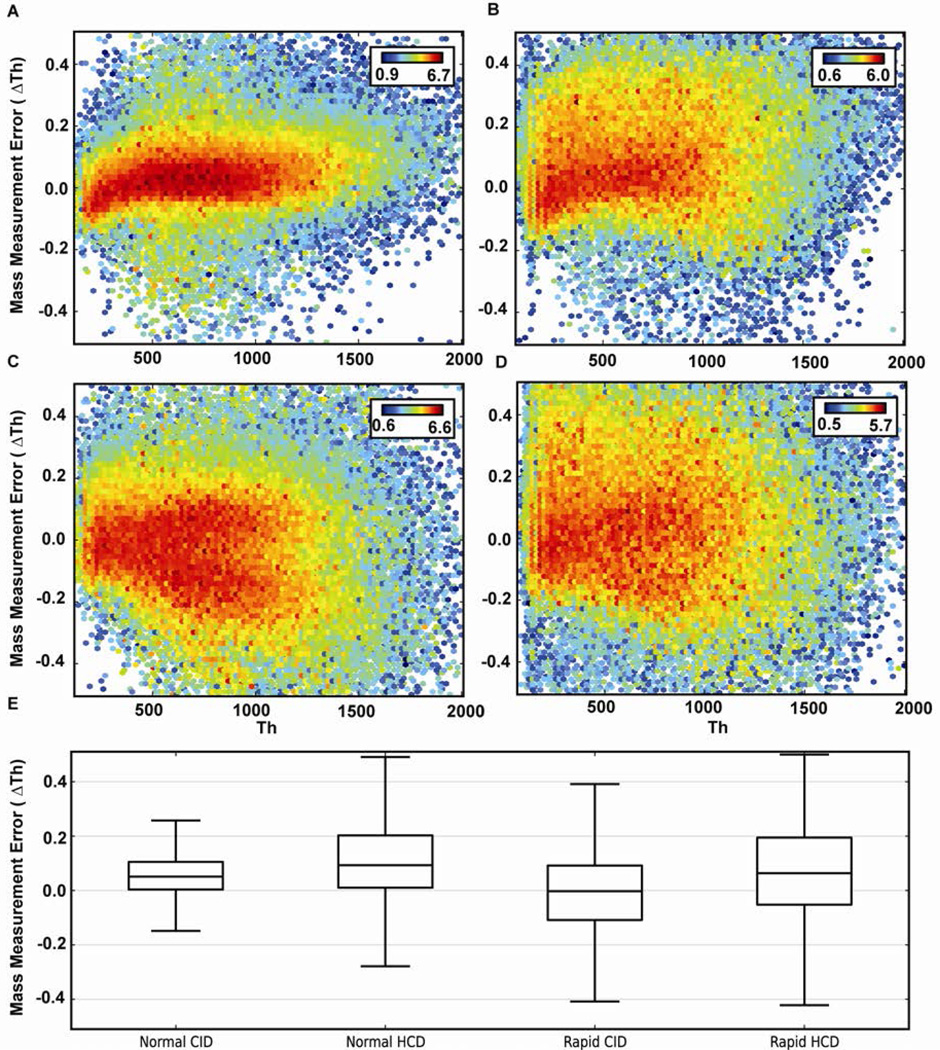
A heat map and box plot comparing the MMA distribution of fragment ions between A) RE-CID normal scan rate; B) fHCD normal scan rate; C) RE-CID rapid scan rate; D) fHCD rapid scan rate. The heat is the log of the summed fragment ion intensity for each bin. E) A box plot comparing the mass errors of each data set. The line through the box represents the median (50th percentile) while the box represents the lower (25th percentile) and upper (75th percentile) quartiles. Whiskers extend to farthest points that are still 1.5 interquartile ranges within the upper and lower quartiles.

