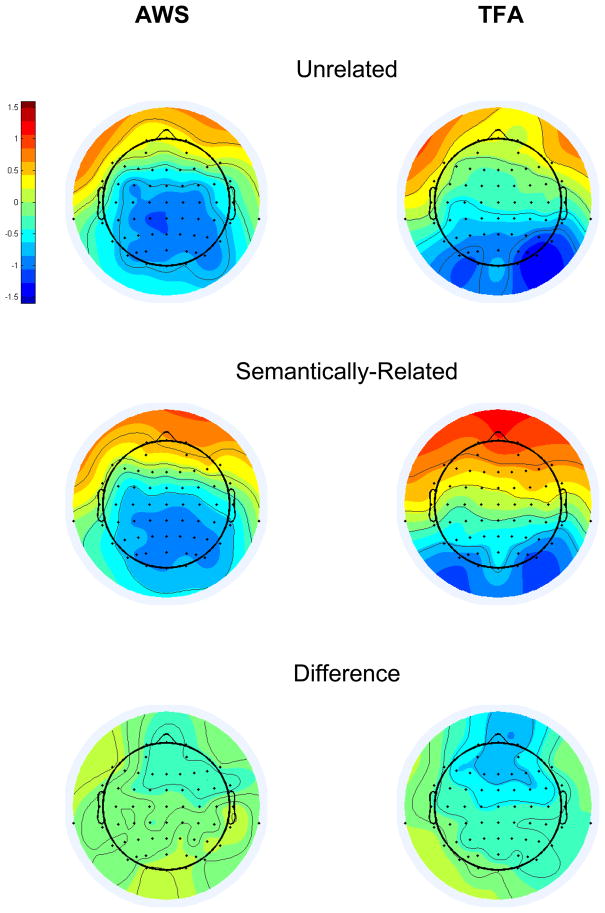
Figure 6.
T760 factor scores, averaged across participants in each group, separately for Unrelated (top panels) and Semantically-Related (middle panels), at each electrode. Bottom panels show the grand average difference scores (Unrelated minus Semantically-Related) for each group at each electrode. The color scale represents the amplitude of the T760 factor scores, which are variance-corrected but not mean-centered (extreme red = 1.6, extreme blue = −1.6).

