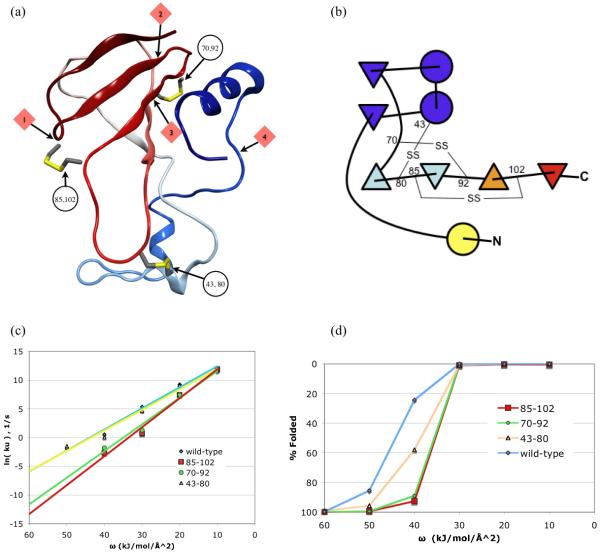
Figure 2.
(a) Barnase ribbon showing locations of first four pivot locations and the disulfide positions. (b) Secondary structure element diagram of barnase showing locations of disulfide linkages. Online color version shows the predominant pathway of unfolding from red (early unfolding) to blue (late unfolding). (c) Simulated unfolding kinetics, showing a slowing effect for mutants 85-102 and 70-92, a result of blocking early unfolding steps. Note that slow unfolding rates with ln(ku) < −5 cannot be measured. (d) Equilbrium unfolding simulation, varying desolvation energy ω.

