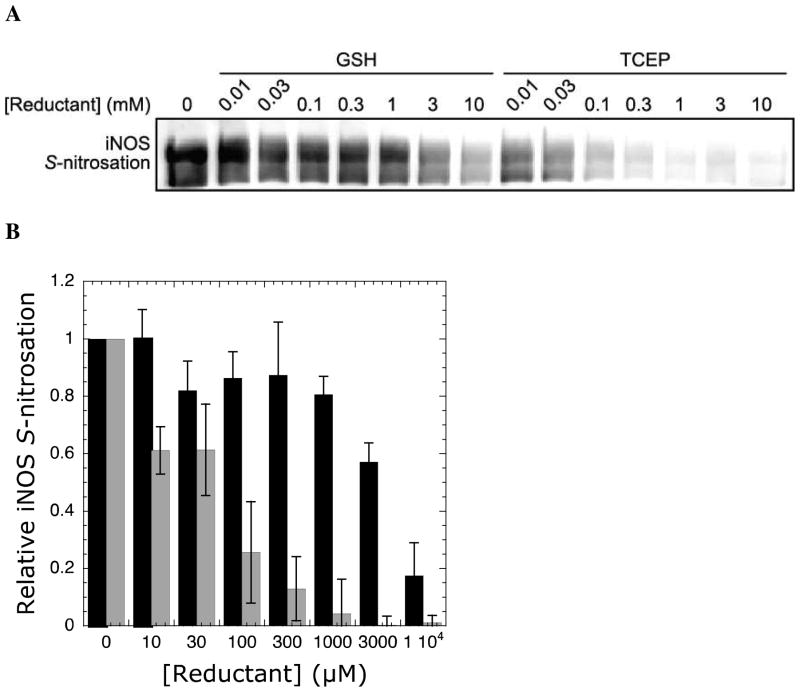
Figure 5.
Protection of iNOS auto-S-nitrosation by reductants. (A) The anti-biotin blot shows a dose-dependent decrease in iNOS S-nitrosation upon addition of GSH and TCEP. (B) Quantitation of anti-biotin blots with increasing concentrations of GSH (black bars) and TCEP (grey bars). Levels of iNOS S-nitrosation were normalized to the level observed with no added reductant. Error bars represent standard deviation from the mean. Each reaction contained 2 μM iNOS, 5 mM Arg, 2 mM NADPH, 50 mM NaCl, and varying concentrations of either GSH or TCEP in HEN buffer (250 mM HEPES, 2 mM EDTA, 0.2 mM neocuproine, pH 7.5) in 100 μL total volume. iNOS activity was initiated by NADPH addition and quenched after 20 min in HEN buffer with 60 mM N-ethylmaleimide and 10% SDS. Relative levels of iNOS S-nitrosation were determined by the biotin switch method (see Experimental Procedures).

