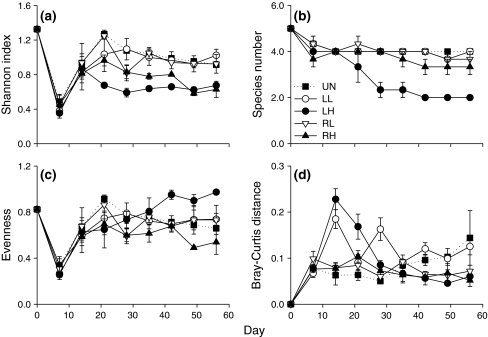
Fig. 1.
Regional diversity and dissimilarity in the undisturbed control (UN), and in the treatments of local low (LL), local high (LH), regional low (RL) and regional high (RH) disturbance. Low disturbance is shown with open symbols, high disturbance with closed symbols; local disturbance treatments are the circles, regional disturbance treatments the triangles. The undisturbed control is shown with dotted line and filled squares. The measures of diversity used were a Shannon-Wiener index, b species number, c evenness, and dissimilarity is expressed as d Bray–Curtis distance, means ± SE, n = 3

