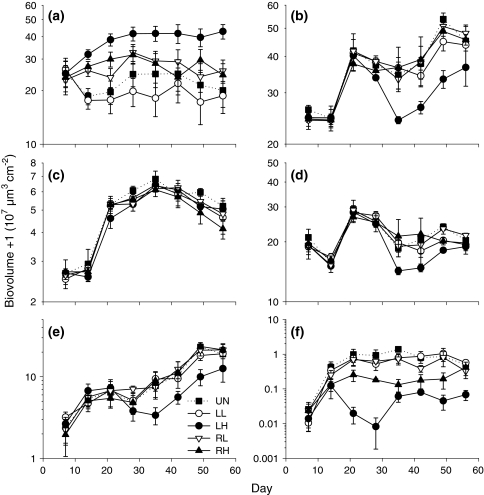
Fig. 4.
a Algal biovolume with values adjusted using ANCOVA to account for the confounding effect of light, b total bacterial biovolume, c bacteria <1 μm, d bacteria 1–5 μm, e bacteria 5–10 μm, f bacteria >10 μm, means ± SE, n = 3. Note that untransformed data are presented on a log scale, while the statistical analyses presented in the text were calculated with log-transformed data. Treatment abbreviations and symbols as in Fig. 1

