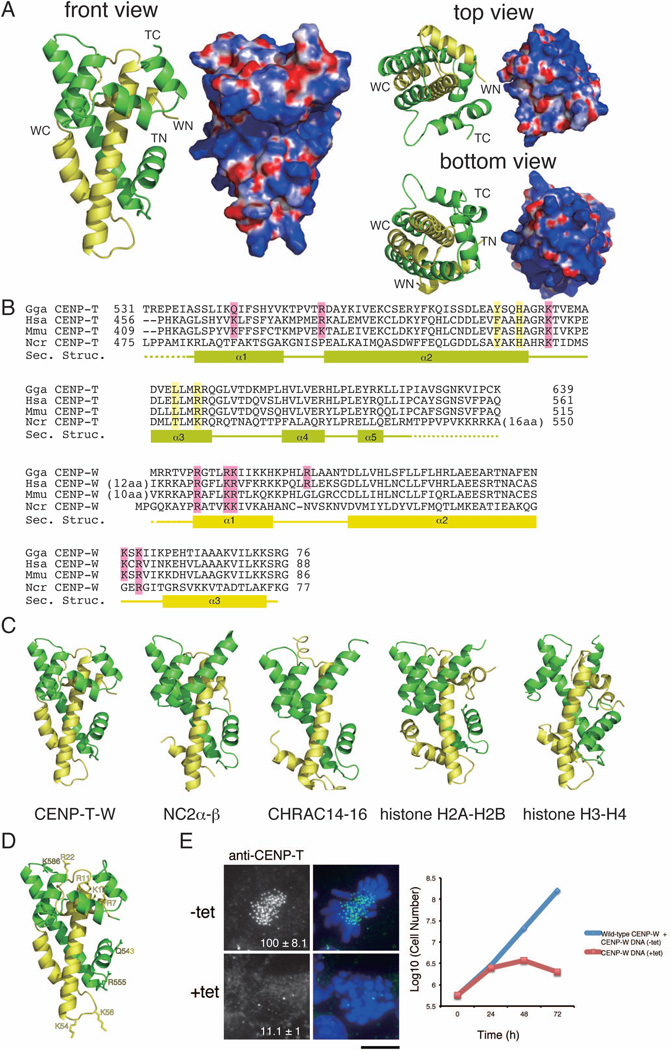
Figure 1. (refers to Supplemental Figure S1 and Table S1). The CENP-T-W complex is a heterodimer with structural similarity to other histone-fold containing protein complexes.
(A) Ribbon diagram representations of the CENP-T-W dimer (left) and its surface charges (right). Three orthogonal views of the CENP-T-W dimer are shown. CENP-T is colored in green and CENP-W is colored in yellow. The N- and C-terminus of CENP-T and CENP-W are shown as TN, TC, WN, and WC, respectively. Electrostatic surface charges of CENP-T and CENP-W were calculated by APBS and are contoured from −8.0 (red) to 8.0 (blue).
(B) Sequence alignment of CENP-T (top) and CENP-W (bottom) from chicken, human, mouse, and Neurospora. Boxes (α1 – α5), solid lines, and dashed lines indicate α-helices, random coil regions, and disordered residues, respectively. Residues marked by pink are predicted as DNA binding sites by comparison with canonical histones and residues marked by yellow are predicted as the tetramerization interface based on comparison to CENP-S-X.
(C) Structural comparison of the CENP-T-W complex with other histone-fold containing protein complexes including NC2α-β (PDB ID: 1JFI), CHRAC14-16 (PDB ID: 2BYK), and histone H2A–H2B and H3–H4 in the nucleosome (PDB ID: 1KX5). The structural alignment is based on the DALI structure alignment server with the structures viewed from the same angle as in (A).
(D) Prediction of the DNA binding sites for the CENP-T-W dimer based on structural similarities of the DNA binding surface in histone H3–H4.
(E) Analysis of DT40 cells in which endogenous CENP-W is replaced with the CENP-WDNA mutant (+tet). In absence of tetracycline (−tet), cells express both wild-type CENP-W and the CENP-WDNA mutant and in the presence of tetracycline (+tet), cells express only the CENP-WDNA mutant. The signal intensity of CENP-T at each kinetochore detected by immunofluorescence was measured relative to an adjacent background signal (n = more than 10 cells; average intensity +/− standard deviation). Bar, 10 µm. The growth curve was measured using Trypan blue exclusion.

