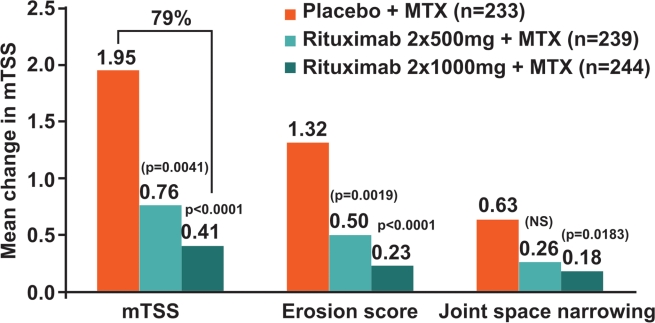
Figure 1.
Change in radiographic end points at 2 years in the modified intention-to-treat population. Linear extrapolation used for missing values. Adjusted p-values comparing rituximab+MTX groups with the placebo+MTX group; values in parentheses are unadjusted, exploratory p-values. mTSS, total Genant-modified Sharp score; MTX, methotrexate; NS, non-significant.

