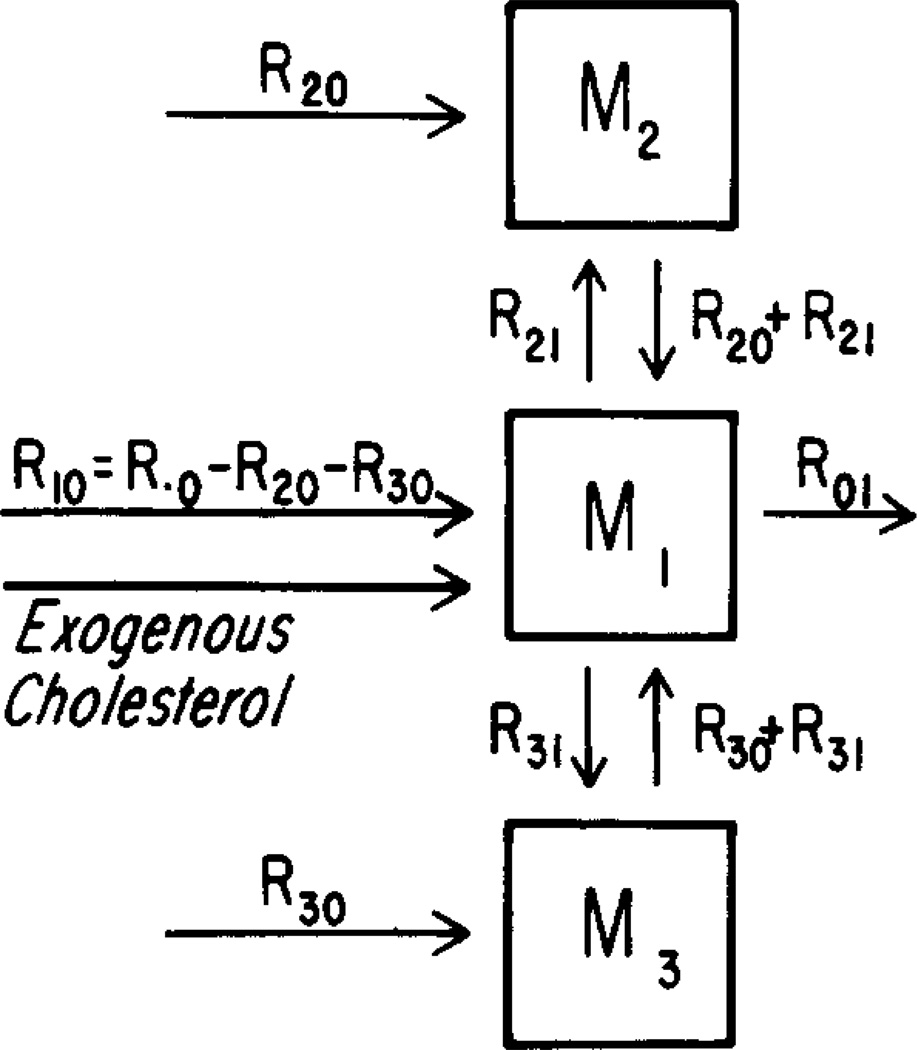
Fig. 2.
A three-pool mammillary model for cholesterol turnover. M1, M2, and M3, are masses of cholesterol (g) in pools 1, 2, and 3, respectively; R’s are cholesterol mass flow rates (g/day); R.0 is the total endogenous cholesterol synthesis rate; R10, R20, and R30, are endogenous synthesis rates into pools 1, 2, and 3, respectively.

