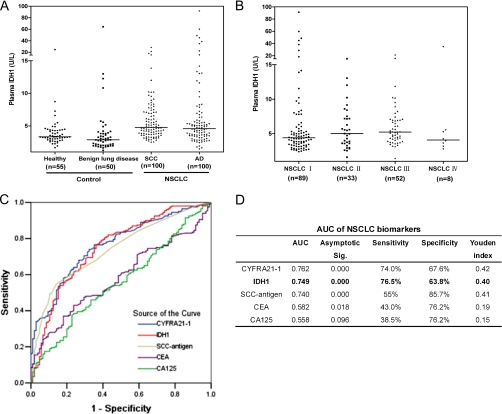
Fig. 4.
Plasma level of IDH1 and four conventional tumor biomarkers (CYFRA21-1, SCC-antigen, CEA, and CA125) in NSCLC patients, healthy individuals, and benign lung disease patients. A, distribution of IDH1 plasma level determined by ELISA in SCC patients, AD patients, healthy individuals, and benign lung disease patients. Median values are shown with a horizontal line. Differences were significant between NSCLC patients and healthy individuals/benign lung disease patients (p < 0.0001, respectively, Mann-Whitney test), between SCC patients and healthy individuals/benign lung disease patients (p < 0.0001, respectively), and between AD patients and healthy individuals/benign lung disease patients (p = 0.0002/p < 0.0001). No significant difference between SCC patients and AD patients was observed (p = 0.217). B, distribution of IDH1 in plasmas of patients with various TNM stages of NSCLC. No significant differences were observed among each stage (p = 0.187, Kruskal-Wallis test). C, ROC curves of IDH1, CYFRA21-1, SCC-antigen, CEA, and CA125 in discriminating NSCLC patients from controls (healthy individuals and benign lung disease patients). x axis, 1-specificity; y axis, sensitivity. D, AUC of each biomarker was listed along with the sensitivity and specificity of each biomarker at their optimal cutoff value, which was determined by maximizing the Youden index.

