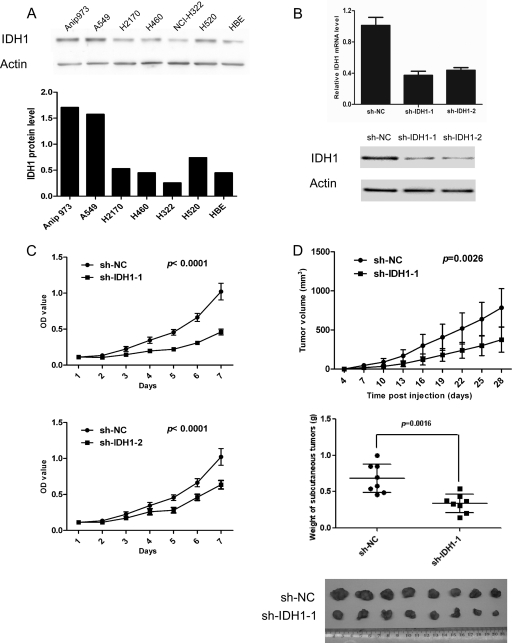
Fig. 5.
Tumor cell proliferation assessed by CCK-8 assays and tumor xenografts. A, expression of IDH1 in six NSCLC cell lines and a normal bronchial epithelium cell line were detected by Western blot (upper panel). β-Actin was used as an internal control. The intensity values of IDH1 expression in various cell lines were normalized against those of controls and shown (lower panel). B, Anip973 cells were stably transfected with two vectors expressing different shRNAs silencing IDH1 (sh-IDH1-1 and sh-IDH1-2) or negative control vector (sh-NC). Knockdown efficiencies of two independent shRNAs were assessed by real time PCR (upper panel) and Western blot (lower panel). C, proliferation of the cells stably transfected with sh-IDH1-1, sh-IDH1-2, and sh-NC were analyzed by CCK-8 assay. The data are expressed as the means ± S.D. from eight replicates in each group. D, cells stably transfected with sh-IDH1-1 or sh-NC were injected subcutaneously in the right flank of athymic nude mice (2 × 10⁶ cells/mouse, eight mice/group). Tumor volume was monitored at indicated times, and tumor growth curves were plotted (top panel). The data are expressed as the means ± S.D. from eight mice in each group. The mice were killed at day 28, and the xenograft tumors were weighed (middle panel) and shown (bottom panel). The data shown are representative of three independent experiments.

