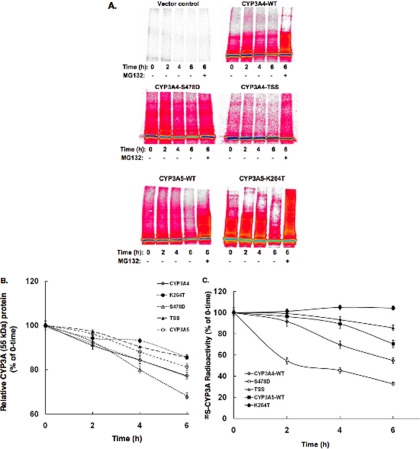
Fig. 4.
Pulse-chase analyses of AdV expressed CYP3A4WT, CYP3A5WT, and mutant proteins in HepG2 cells. For details see “Experimental Procedures.” The experiments were conducted in triplicate for each P450 protein. A, a prototypical PhosphorImager scan is shown for each CYP3A protein. Some cells were also treated in parallel with MG132 for 6 h. TSS stands for the CYP3A4T264A/S420A/S478A mutant. The color wheel intensity code is as follows: black > dark blue > light blue > green > yellow > orange > red > magenta > white. B, the time-dependent loss of each 35S-labeled parent CYP3A protein following pulse-chase by densitometric quantification of the corresponding 55-kDa band. The values are the means ± S.D. of three individual HepG2 cultures, each individually immunoprecipitated. The calculated half-life of each parent CYP3A protein was as follows: CYP3A4WT (13.2 h), CYP3A5WT (15.9 h), CYP3A4S478D (9.5 h), TSS (20.3 h), and CYP3A5K264T (22.7 h). C, the time-dependent loss of each 35S-labeled CYP3A protein (parent + ubiquitinated HMM species) following pulse-chase as determined by scintillation counting of aliquots of 35S-CYP3A immunoprecipitates. The values are the means ± S.D. of three individual HepG2 cultures. The 100% (mean ± S.D.) values for 0-h 35S-CYP3A immunoprecipitates were 74943 ± 2780 cpm.

