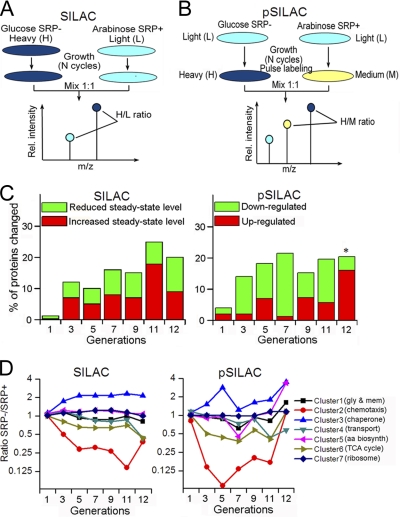
Fig. 1.
Outline of proteomic methods and global analysis of the proteomic data. (A, B,) Overview of the SILAC (A) and pSILAC (B) procedures, as described in the text and in the Experimental Procedures. C, Overview of the number of proteins whose expression (pSILAC) and steady-state (SILAC) levels changed over twofold after SRP depletion. Asterisk denotes that at the 12th generation, only the proteins whose expression (normalized ratio in pSILAC) is up-regulated over fourfold were considered; this was done to correct for potential overnormalization during MaxQuant analysis of the data at this generation, as explained in the Experimental Procedures. D, Protein clusters were generated based on different patterns of changes upon SRP depletion, as described in the Experimental Procedures. The proteins enriched in each cluster are denoted in the parenthesis and listed in supplemental Table S1B. Gly and mem, glycolysis and membrane proteins; aa biosynth, amino acid biosynthesis. Cluster 1 includes proteins that were unchanged in SILAC but slightly downregulated in the seventh generation and/or altered in the 12th generation in pSILAC. Cluster 2 includes proteins significantly and immediately down-regulated in both SILAC and pSILAC. Cluster 3 includes proteins that exhibited two spikes of induction in the fifth and 11–12th generations in pSILAC. Cluster 4 includes proteins that were specifically downregulated at the 11–12th generations. Cluster 5 includes proteins that exhibited qualitatively similar pattern but a greater extent of changes than those in cluster 1. Cluster 6 includes proteins that exhibited qualitatively similar patterns of changes as those in cluster 2, but the extent of changes is smaller. Cluster 7 includes proteins that were not significantly changed upon SRP depletion.

