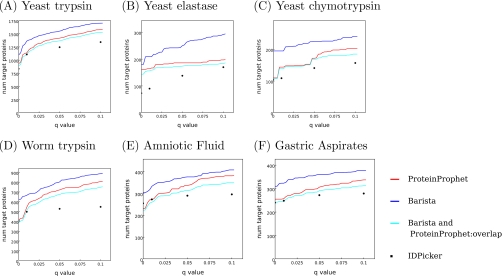
Fig. 2.
Comparison of ProteinProphet, IDPicker, and Barista performance on sample data sets. A–F plot the number of target proteins as a function of q value threshold for three protein identification methods. The cyan series indicates the degree of overlap between proteins identified by Barista and ProteinProphet. All of the results are reported with respect to the set of proteins that received probabilities greater than 0 from ProteinProphet.

