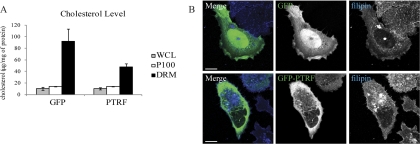
Fig. 5.
PTRF expression changes cholesterol dynamics in lipid rafts. PC-3 cells were transiently transfected with GFP or GFP-PTRF. A, Whole cell lysates, P100, or DRM fractions were isolated from the cells and a cholesterol assay performed. The graph shows the mean cholesterol level ± S.E. (n = 3). B, GFP and GFP-PTRF cells were stained with filipin and analyzed by fluorescent confocal microscopy to detect cholesterol localization. GFP-PTRF expressing cells displayed a more pronounced intracellular pool of cholesterol. Scale bar = 20 μm.

