Fig. 4.
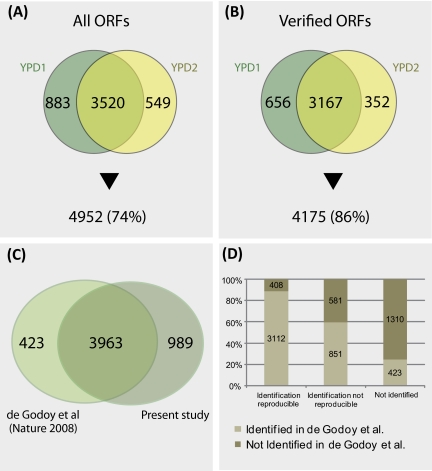
Comparison of predicted proteome and observed protein profile. A, A Venn diagram shows the proteins detected in single samples or both replicates (YPD1 and YPD2) as compared with all predicted open reading frames (ORFs). B, Idem taking only the verified ORFs into consideration. The percentage of detected proteins is indicated. C, A Venn diagram comparing the proteins identified in SK1 and in S288c (15) is shown. D, A graph summarizes the numbers of proteins identified twice in SK1 and in S288c (first column), proteins identified once in SK1 and in S288c (second column) and proteins not identified in this study but in S288c (third column).

