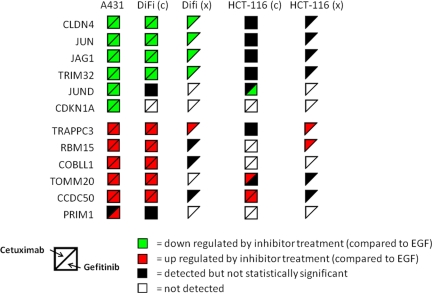
Fig. 4.
Summary of expression changes for EGFR inhibition signature proteins in cell lines and mouse xenograft models. Symbol colors indicate decreased expression (green); increased expression (red); detected, but no significant change (black) compared with EGF treatment in cells (c) or compared with vehicle control in xenografts (x); and not detected (white). Only cetuximab treatment was used in xenograft experiments.

