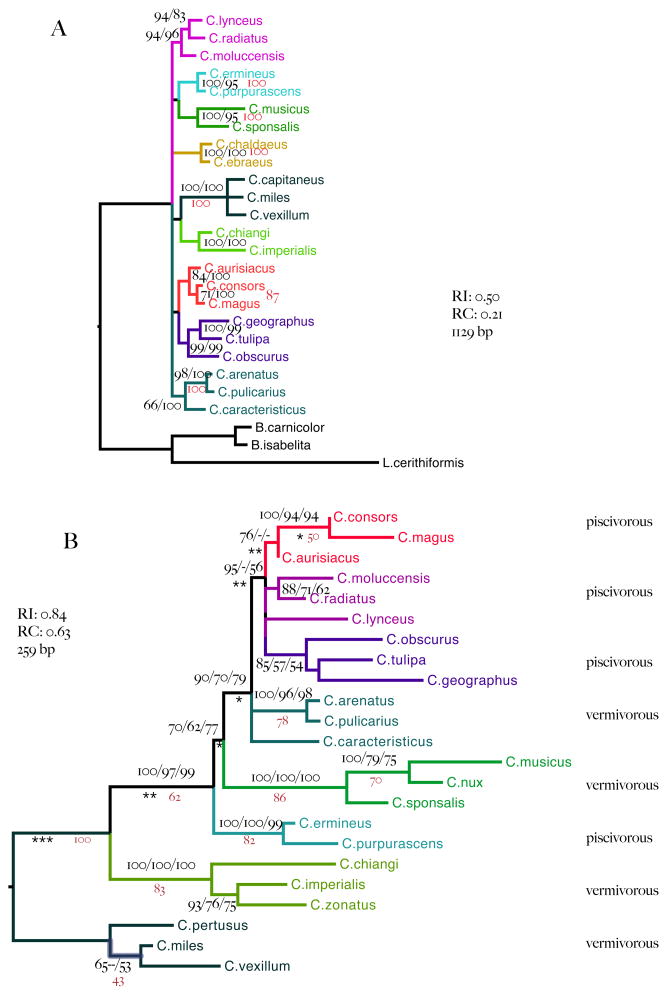
Figure 2.
A. Tree inferred from 12S and 16S mt rRNA sequences. Branches are labeled with Bayesian support values (right; posterior probabilities expressed as percentages) and maximum likelihood bootstrap proportions (left). B. Tree inferred from intron 9 CIS sequences alone. Branches are labeled with posterior probabilities (left) maximum likelihood bootstrap proportions (middle) and maximum parsimony bootstrap proportions (right). Missing values indicate that the corresponding support value is less than 50%. Maximum likelihood and Bayesian estimated branch lengths depart significantly from strict molecular clock assumptions. Local clock rates better describe sequence evolution at branches marked with asterisks (departures from a strict clock rate significant at p<0.5 *, p <0.01 ** and p<0.0001 ***).

