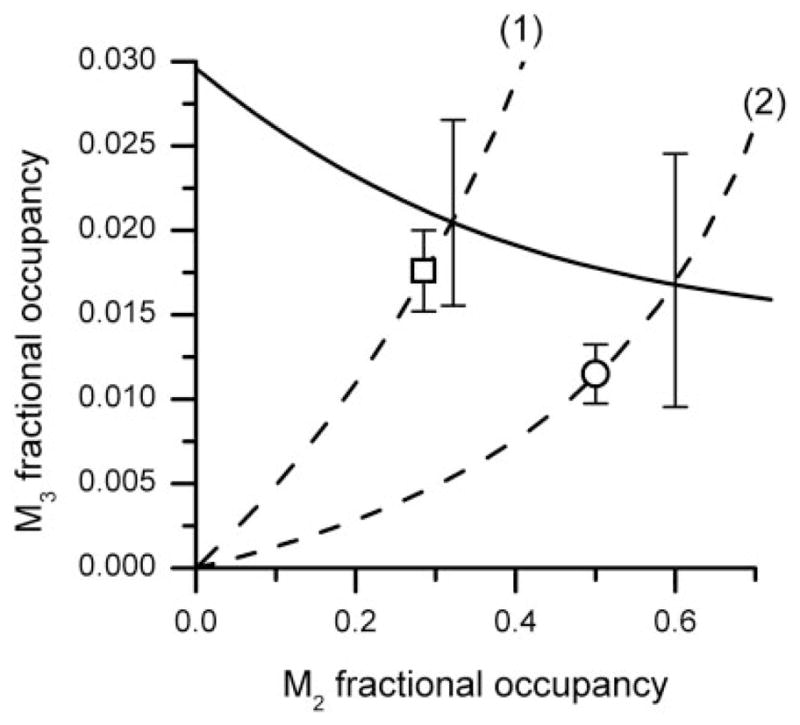
Fig. 5.

The isobole of additivity (solid curve) for effect = 40% KCl maximum is shown along with path (1) representing M2-M3 occupation pairs for carbachol and path (2) representing carbachol M2-M3 occupation in presence of 30 nM atropine. The intersection of each path with the isobole gives the expected M2-M3 combination (shown with S.E. bar). The experimentally derived values are shown as □ and ○ and are not statistically significantly different from their respective intersection points, thereby indicating a simply additive interaction between the M2 and M3 receptors occupied by carbachol.
