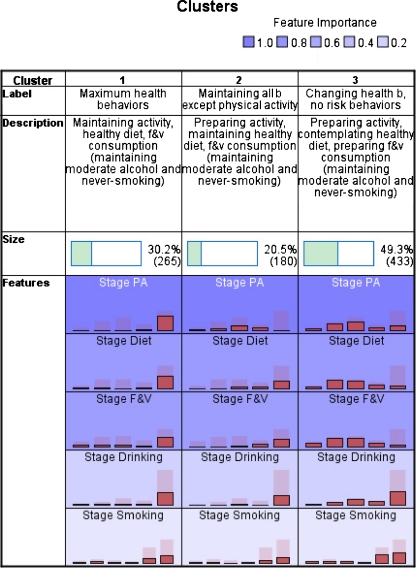
Fig. 2.
Groups generated with two-way cluster analysis (study 2). Background color Importance = 1 (Stage PA); Importance = 0.75 (Stage Healthy Diet); Importance = 0.71 (Stage F&V); Importance = 0.21 (Stage Drinking); Importance = 0.01 (Stage Smoking); bars in the rows of Feature represent frequencies for the stages (PC, C, P, A, M for all behaviors excepts smoking, and PC, C, P, A, M, never-smokers for non-smoking)

