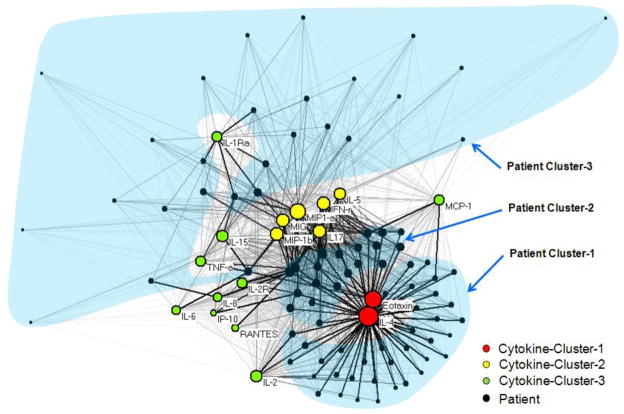
Figure 1.
A bipartite network (automatically laid by the Kamada-Kawai algorithm [21]) shows how 18 cytokines (colored nodes) co-occur across 83 patients (black nodes). The thickness of the edges is proportional to the normalized cytokine expression values, and the size of the nodes is proportional to the sum of the edge weights that connect to them. Therefore patients with high total cytokine values have large nodes, and higher cytokine values are represented by thicker edges. For clarity, colors represent cytokine clusters, transparent blue shapes represent patient clusters, and patient IDs are not shown. See Supplementary Figure A, which shows the same network shown here, but with the patient nodes colored by severity to help examine the relationship of the current severe vs. non-severe classification, to the patient clusters.

