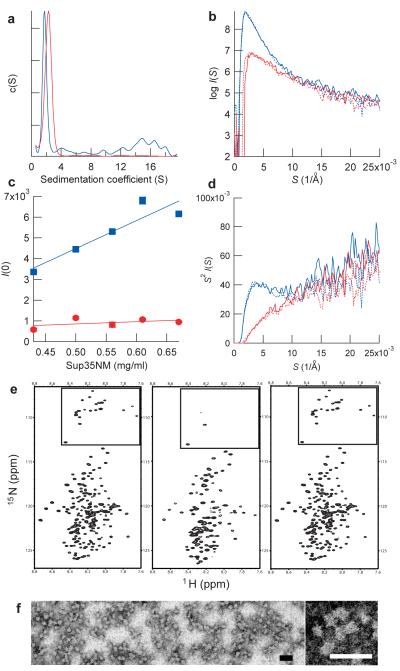
Figure 1. Sup35NM forms oligomers in a temperature-dependent, reversible manner.
(a) Sedimentation coefficient distributions of Sup35NM at 4°C (blue) and 37°C (red).
(b) SAXS profile of Sup35NM protein. SAXS profile was first measured at 4°C (blue solid line) and the temperature was increased to 37°C (red solid line), returned to 4 °C (blue broken line) and finally shifted again to 37°C (red broken line).
(c) Concentration-dependent changes in scattering intensities of Sup35NM protein at 4°C. Maximum scattering intensities of Sup35NM protein at 4°C (blue) and 37 °C (red) were plotted against the concentration of Sup35NM.
(d) Kratky plot of the SAXS profile shown in b. The peak at 4 Å−1 for Sup35NM at 4°C indicates the presence of globular structures20.
(e) HSQC NMR spectra of Sup35NM protein. Spectra were first measured at 25 °C (left), the temperature was decreased to 10 °C (center), and finally returned to 25 °C (right). The boxed area shows signals from glycines in Sup35NM.
(f), Images of Sup35NM oligomer by transmission electron microscopy (left). A zoomed view of Sup35NM oligomer (right). Scale bar, 50 nm.

