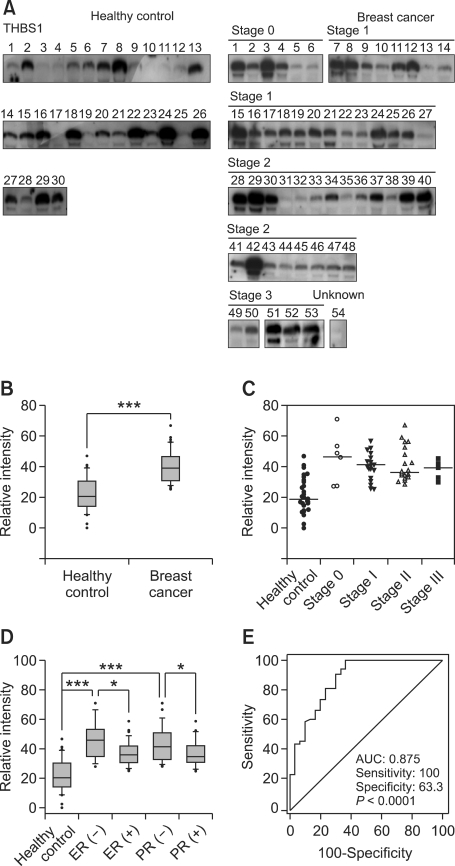
Figure 4.
THBS1 level in plasma of breast cancer patients and healthy controls. (A) Western blot analysis was performed for THBS1 with the plasma samples from 54 breast cancer patients as well as 30 age-matched healthy controls. (B) Western blot images were scanned and their intensities were determined by densitometry and the data are presented as a box plot. (C) THBS1 levels are presented according to the pathological grade. Horizontal bars represent median values. (D) THBS1 levels are presented according to ER and PR status. (E) The relationship between the specificity and the sensitivity of THBS1 measurement for the detection of breast cancer is represented by an ROC curve. The AUC value is 0.875. The number of asterisks denote significance level of differences (***P < 0.001, **P < 0.01 and *P < 0.05, Mann-Whitney U test) in the median values of each comparison.

