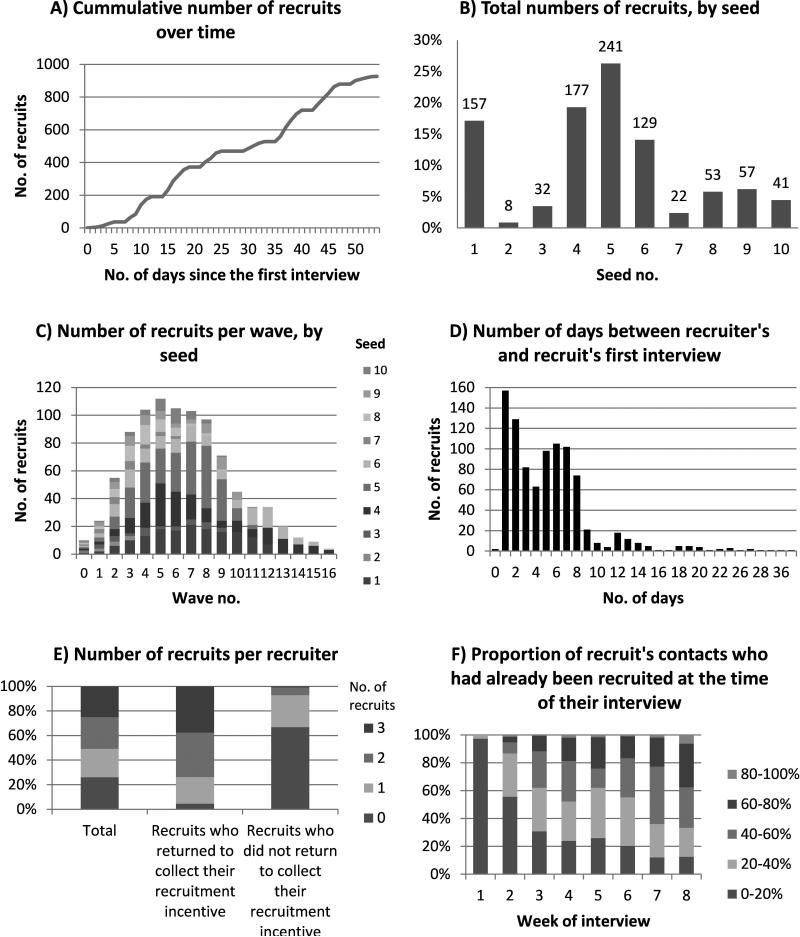
Figure 2. Summary of the dynamics of respondent-driven sampling survey recruitment.
(A)The cumulative number of recruits over time (including seeds). (B) The total number of recruits per seed (excluding seeds). (C)The number of recruits by wave and seed (including seeds).(D) The number of days between recruiters’ interview and their recruits’ first interview. (E) The number of recruits per recruiter, overall and by whether the recruiters returned for incentive collection (including seeds). (F) The proportion of recruit's network who had already been recruited at the time of their interview (using network size definition NS-5, including seeds).

