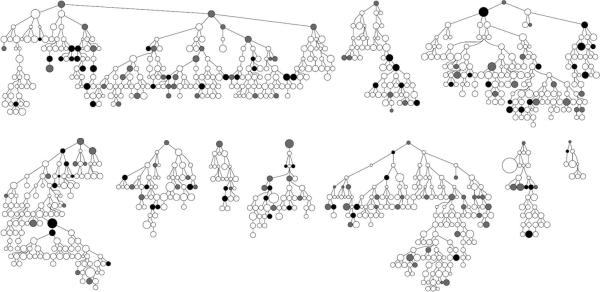
Figure 3. Recruitment networks showing HIV infection status, by seed.
Seeds are shown at the top of each recruitment network. Symbol area is proportional to network size. HIV serostatus is shown by shading: black indicates HIV positive; white, HIV negative; grey, HIV status unknown. HIV status omitted for seeds for confidentiality.

