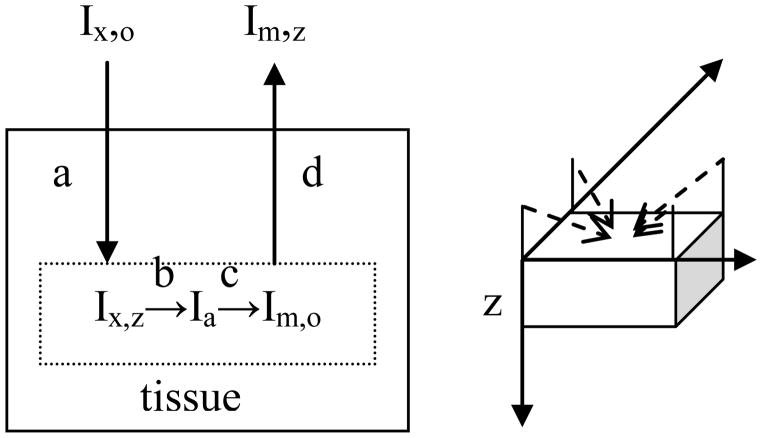
Figure 1.
Schematic diagram of processes affecting the light intensity (a) attenuation of excitation light, (b) light absorption by fluorophore, (c) fluorescent light emission, and (d) attenuation of emitted light and relationship to the geometry of the image. The axis system used is shown to the right with z taken as a measure of depth starting from the surface of the tissue. The four dotted lines indicate the diagonal arrangement of the four excitation light sources positioned at a 45° angle to the plane of the surface of the sample.

