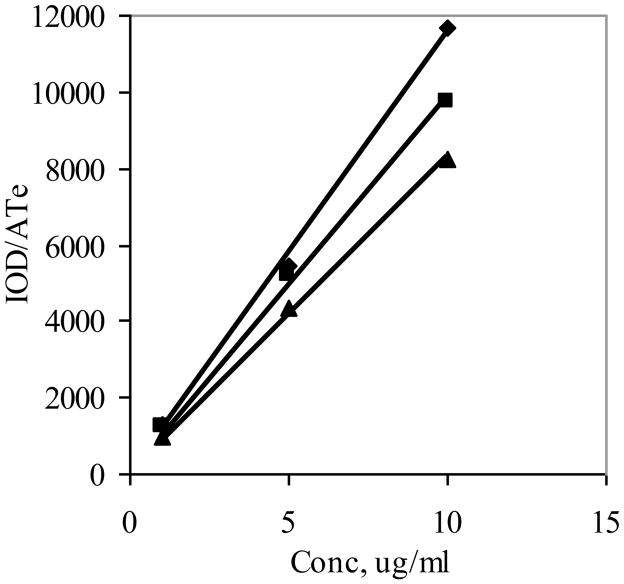
Figure 5.
Images of the AlPCS in lung homogenate:buffer dispersion (1:1) with depths of (▲) 0.072, (■) 0.1, and (◆) 0.127 cm were obtained as a function of concentration and the integrated intensity normalized to the number of pixels, A, and exposure time, Te, is plotted as a function of concentration (n=3, where the SD is smaller than the size of the point).

