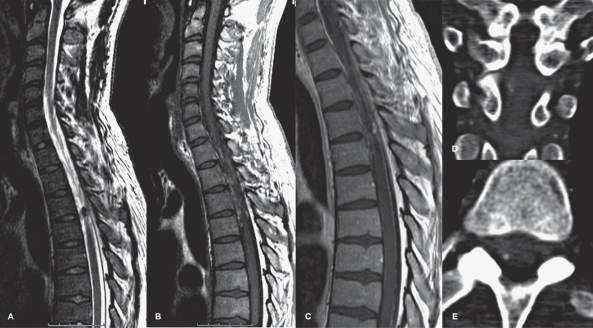
Figure 1.
Sagittal T2W(A), T1W(B) and T1W post Gd (C) MR of the spine demonstrating T1 hyperintensities around the cord from T1 to T4 levels, representing spinal SAH. A circumscribed area of T2 hypointensity at the dorsolateral aspect of the cord at T3 level is noted, with nodular enhancement following contrast administration. CT angiography in coronal reformatted (D) and axial (E) views reveals the exact location of the aneurysm at the right dorsolateral aspect of the cord.

