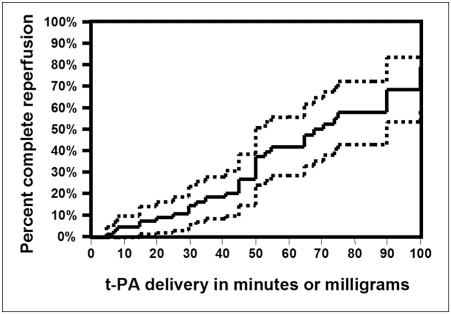
Figure 1.
Kaplan Meier plot of complete reperfusion relative to t-PA delivery time. The dotted lines represent 95% confidence intervals. Note: because t-PA dose is delivered at a specified rate, it is time dependant and can be substituted here for time (see text). This plot suggests that if t-PA infusion is continued beyond 50mg, reperfusion occurs at a rate similar to lower doses. Calculated reperfusion rates presented in this plot only apply if continued infusion is always possible (see text).

