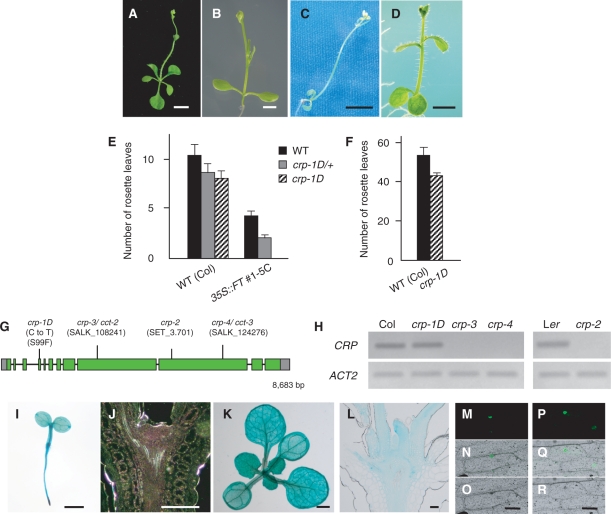
Fig. 1.
Flowering phenotype of the crp-1D mutant and gene structure and expression patterns of CRP. (A–D) Effect of crp-1D and soc1-101D on the early-flowering phenotype of 35S::FT. 35S::FT #1-5C (A), 35S::FT #1-5C/−; crp-1D/+ (B), 35S::FT #1-5C; crp-1D (C) and 35S::FT #1-5C; soc1-101D plants (D). ‘Transgene symbol/−’ and ‘mutation symbol/+’ indicate the hemizygote and heterozygote, respectively. (E) Flowering time of 35S::FT #1-5C/−; crp-1D/+ plants under long-day conditions. There is a statistically significant difference (Student’s t-test, P < 0.005) with CRP+ (solid bars). (F) Flowering time of the crp-1D mutant under short-day conditions. There is a statistically significant difference (Student’s t-test, P < 0.005) between the two genotypes. (G) CRP gene structure and positions of mutations and T-DNA or Ds insertions in crp alleles. Boxes and lines indicate exons and introns of CRP, respectively; gray and green boxes represent untranslated regions and coding regions, respectively. (H) Semi-quantitative RT–PCR analysis of CRP expression in the wild type and crp mutants. Plants were harvested on day 10 (Col background; left panel) or 7 (Ler background; right panel). (I–L) Spatial expression patterns of CRP. Whole-mount preparation and longitudinal section through the SAM of 3-day-old (I, J) and 10-day-old (K, L) CRP::GUS seedlings. Plants were grown under long-day conditions and subjected to GUS staining for 12–48 h. (M–R) Subcellular localizaton of CRP and crp-1D proteins. Onion epidermal cells were bombarded with GFP fusion constructs, 35S::CRP-GFP (M–O) and 35S::crp-1D-GFP (P–R). Dark field images (M, P), bright field images (N, Q) and merged images (O, R). Scale bars: 5 mm in A and C, 2 mm in B and D, 1 mm in I and K, and 0.1 mm in J, L, O and R. In E and F, the numbers of rosette leaves are the average of at least 11 plants. Error bars indicate the SD. Additional data and statistics of the data are summarized in Supplementary Tables S1 and S2.

