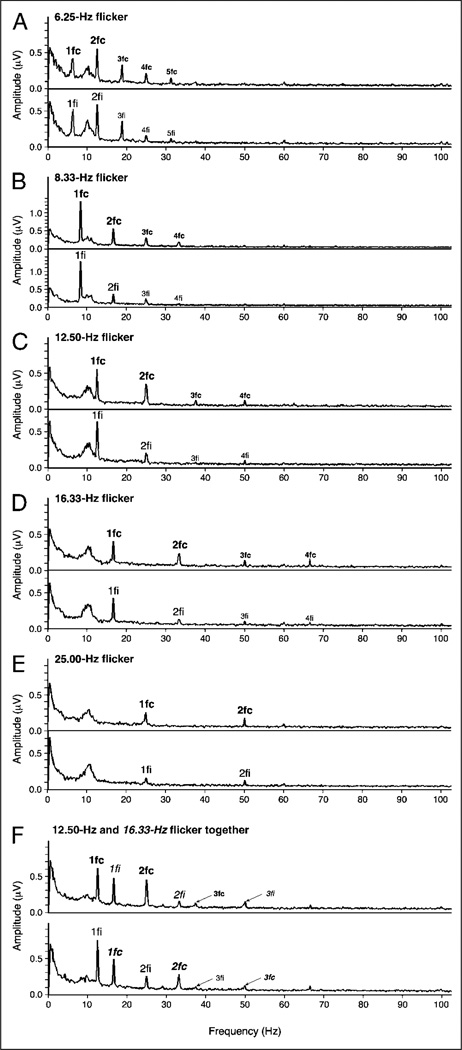
Figure 2.
(A–E) Spectral plots of EEG (amplitude in µV as a function of response frequency, averaged across observers) evoked by a single circular grating presented to the left or right visual hemifield and flickered at different frequencies (data from Experiment 1). For each flicker frequency, the upper graph shows responses averaged from contralateral-posterior electrodes, and the lower graph shows responses averaged from ipsilateral-posterior electrodes (see the illustration in Figure 4B for the locations of these electrodes). (F) Spectral plots of EEG evoked by two simultaneously presented gratings (one in each visual hemifield) (data from Experiment 2, averaged across attended and ignored conditions). The spectral peaks corresponding to the first, second, third, etc., harmonics are labeled with 1fc, 1fi, 2fc, 2fi, 3fc, 3fi, etc., where “c” indicates responses from the contralateral-posterior electrodes and “i” indicates responses from the ipsilateral-posterior electrodes. (F) Harmonic labels for the 16.67-Hz flicker are italicized to distinguish them from the labels for the 12.50-Hz flicker. Note that the first harmonic (both ipsilateral and contralateral) and the contralateral second harmonic are clearly above noise in all cases.

