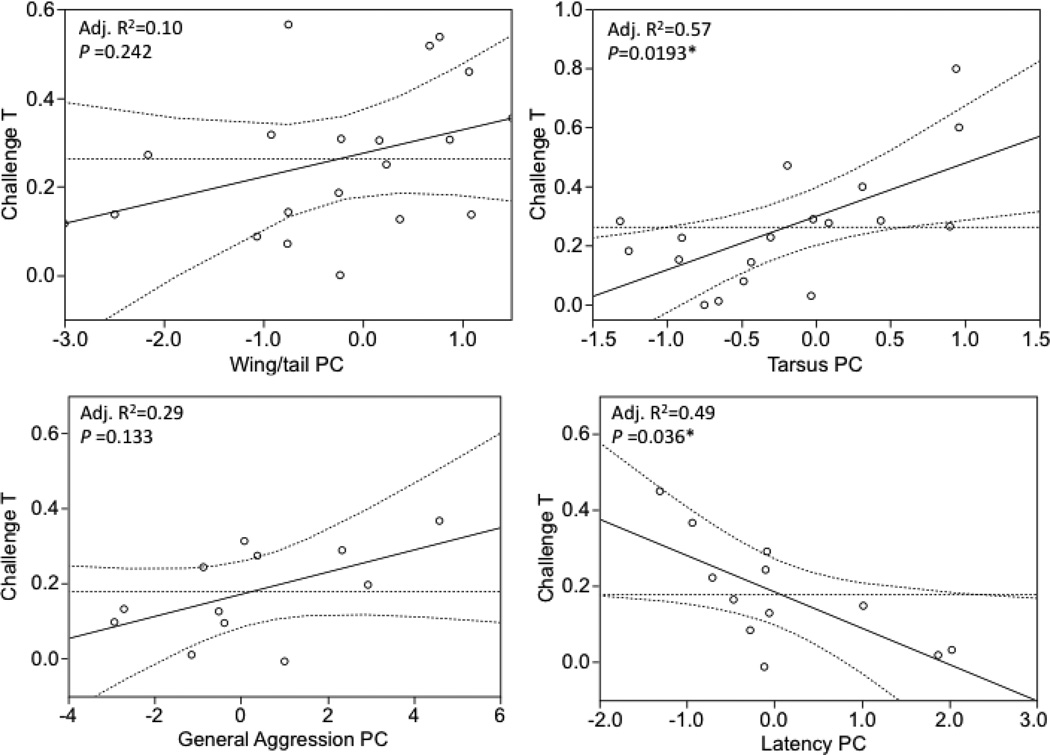
Fig 2.
Visual illustration of the relationship between individual hormonal phenotype, morphology and behavior. Points are leverage plot pairs showing the relationship between variables controlling for other predictors in the model, akin to a partial correlation. Curved lines are 95% confidence intervals; R2 values calculated using leverage plots pairs, p values from multiple regression.

