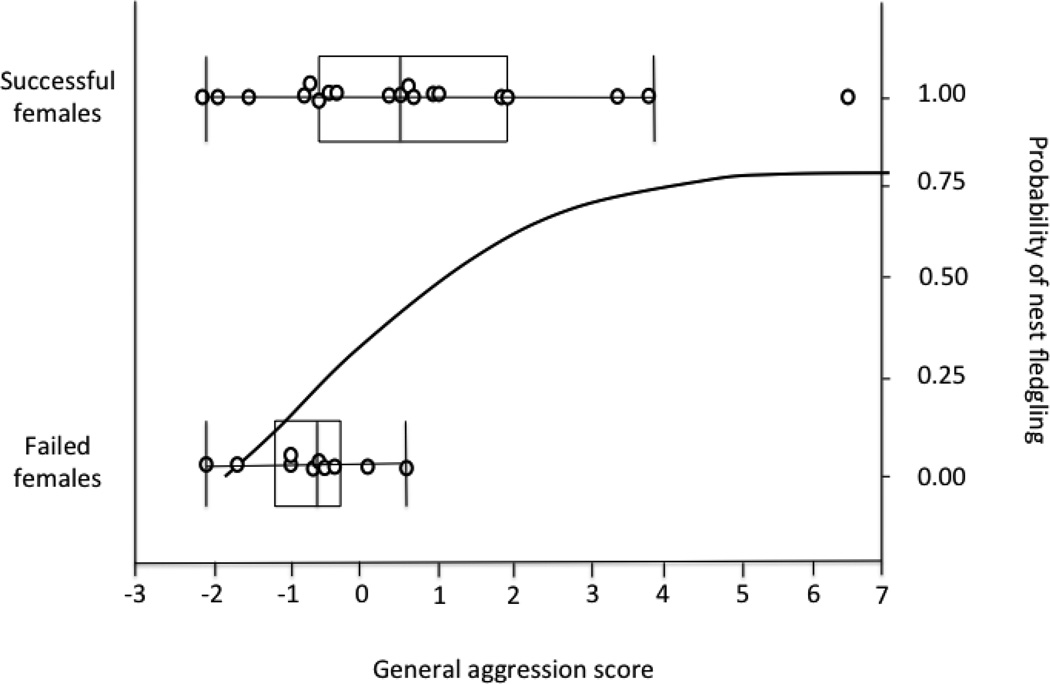
Fig 3.
Relationship between General Aggression PC and nest success. Individual nests are plotted according to nest fate and General Aggression PC (overlapping points are jittered slightly for visual clarity). The curved line is the logistic regression line relating the probability that young in nest survive to the age of leaving the nest (fledging) according to the General Aggression PC of the female.

