
Figure 4.
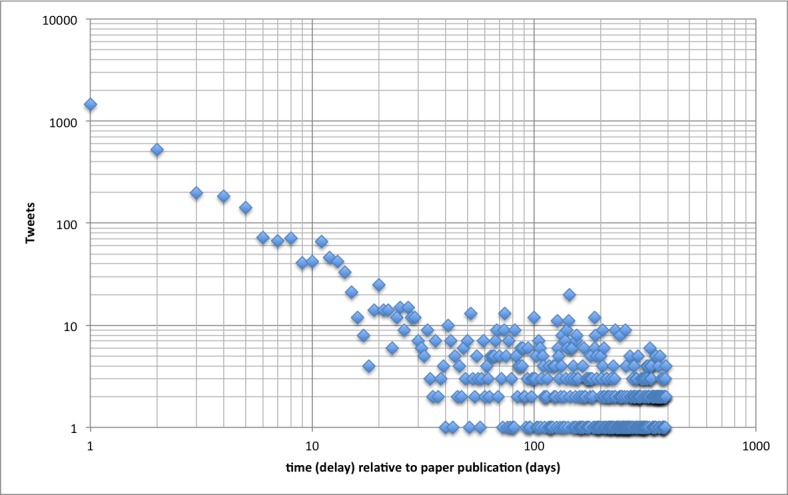
Tweetation dynamics over time on a log-log scale. All tweetations were categorized according to when, in relationship to the cited article publication date, they were tweeted (x-axis), with 1 being the day of article publication.
Official websites use .gov
A
.gov website belongs to an official
government organization in the United States.
Secure .gov websites use HTTPS
A lock (
) or https:// means you've safely
connected to the .gov website. Share sensitive
information only on official, secure websites.
Tweetation dynamics over time on a log-log scale. All tweetations were categorized according to when, in relationship to the cited article publication date, they were tweeted (x-axis), with 1 being the day of article publication.