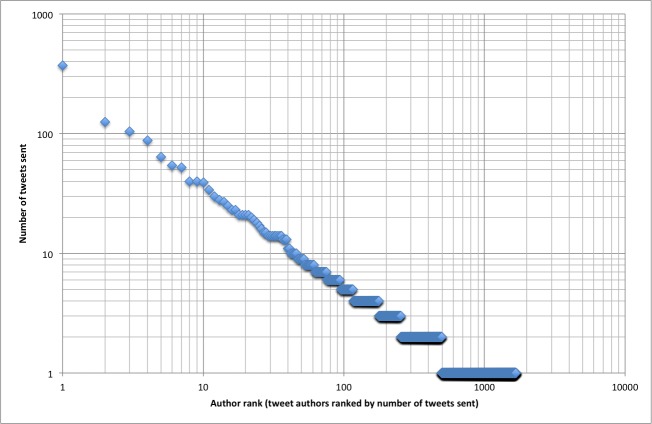
Figure 6.
Tweetation density by account. Each Twitter account is ranked by the number of tweetations sent and plotted by rank on the x-axis. The y-axis shows how many tweetations were sent by each ranked account. For example, the top Twitter account ranked number 1 (@JMedInternetRes) sent 370 tweetations. Note the linear pattern on a log-log scale, implying a power law.

