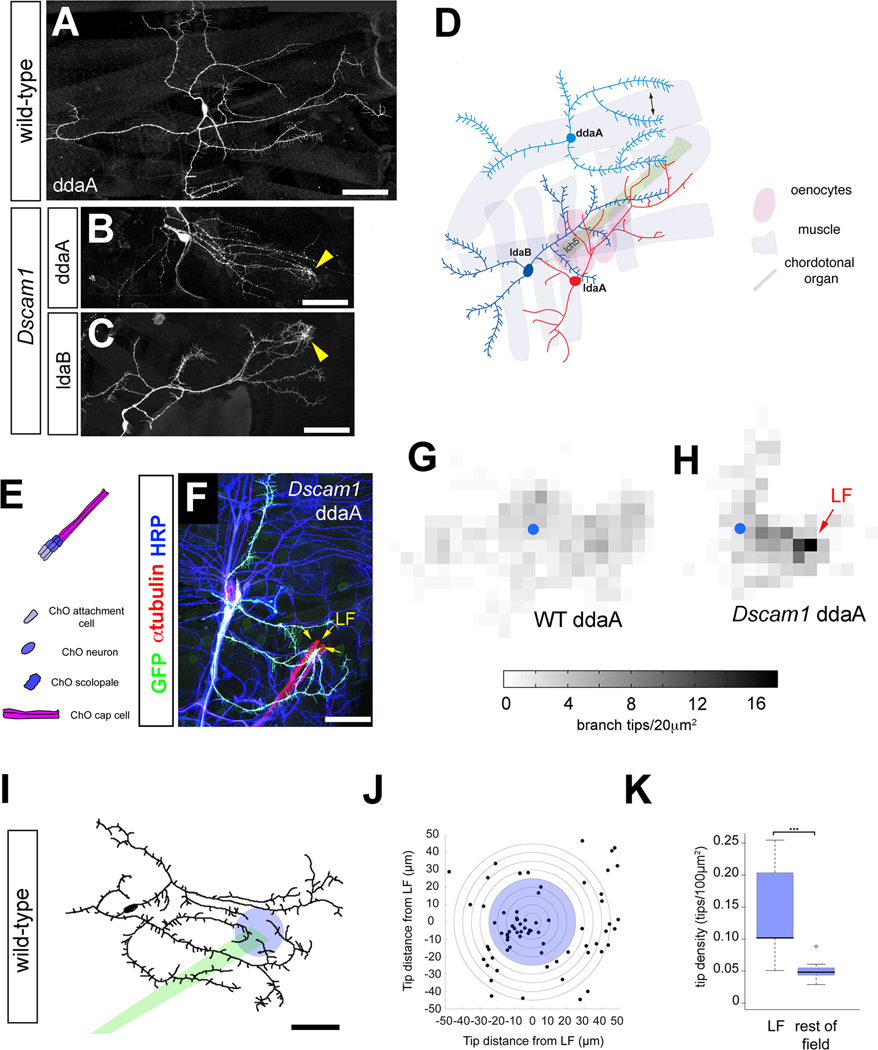
Figure 1. Targeting of Dscam1 mutant neurons to chordotonal organs.
(A) Wild-type MARCM clone of the class III neuron ddaA. Sister dendrites show robust self-avoidance.
(B) Dscam121 mutant MARCM clone of class III neuron ddaA shows branch overlap and dendrite accumulation (yellow arrowhead).
(C) Dscam123 mutant MARCM clone of class III neuron ldaB shows branch overlap and dendrite accumulation (yellow arrowhead).
(D) Schematic of da neurons and nearby non-neuronal cells, including muscle, oenocytes, and chordotonal organs. Epidermal cells upon which dendrites grow are not included in the schematic.
(E) The lateral chordotonal organ (LCHO) consists of a distal cap cell, a scolopale cell, neuron, and proximal attachment cell.
(F) Labeling of a Dscam121 mutant ddaA MARCM clone with anti-GFP, anti-α-tubulin, and anti-HRP reveals accumulation at the distal margin of LCHO in abdominal segments, termed the lateral focus (LF; yellow arrows).
(G) Density plot of all ddaA dendritic termini for wild-type (WT; n=8) MARCM clones. The average numbers of branch endings per cell that terminate within each 20µm2 square are plotted, with higher terminal density indicated by increasing grayscale. Blue circle indicates the position of the cell body.
(H) Density plot of ddaA dendritic termini for Dscam1 MARCM clones (n=4). The average numbers of branch endings per cell that terminate within each 20µm2 square are plotted as in (G). Blue circle indicates the position of the cell body. The accumulation of dendrite tips at LF in Dscam1 mutant clones is indicated by a red arrow.
(I) Tracing of a wild-type ddaA neuron labeled with 189Y-Gal4, UAS-mCD8::GFP. A green bar indicates the trajectory of the chordotonal organ, LCHO. A blue circle with a 25μm radius is centered at LF.
(J) Dendritic tips of ddaA in wild-type larvae are enriched within a 25μm radius of LF when branch tips of multiple cells (n=11) are plotted with respect to LF.
(K) The density of branch tips in a circle of radius 25μm is significantly greater than the rest of the dendritic field.
All scale bars = 50μm.
Datasets are presented in boxplots as median (thick line), quartiles Q1–Q3 (25%–75% quantiles; shaded box), and data in 1.5× quartile range (dashed bars). Data points outside these ranges are indicated as open circles.
* = p < 0.05; ** = p < 0.01; *** = p < 0.001 by Wilcoxon rank-sum test
See also Supplemental Figure S1

